

 한국어
한국어

- US point-of-use water treatment reached $4.52 billion in 2025 and is projected at $8.18 billion by 2033, a 7.76% CAGR (Grand View Research, 2026).
- Point-of-use is the larger residential segment, but whole-house is the faster-growing one at a 6.7% CAGR through 2031 (MarketsandMarkets, 2026).
- Roughly 42% of the US residential market is replacement demand, which makes cartridge economics as important as appliance sales for importers.
- Lead-pipe replacement, EPA PFAS limits, and aging infrastructure are pulling demand into both segments simultaneously.
The US residential water treatment market is not one market. It splits at two install points: the point of use, where a single tap or under-sink unit treats drinking water, and the point of entry, where a whole-house system treats everything coming through the main line. The two segments move at different speeds, for different reasons, and importers who treat them as one category misread where the margin actually sits.
The numbers make the split concrete. Point-of-use is the larger dollar pool and the steadier business. Whole-house is smaller but compounding faster. Both are being pushed by the same underlying force: a municipal pipe network that is aging faster than municipalities can fund it.
Two install points, two sets of economics
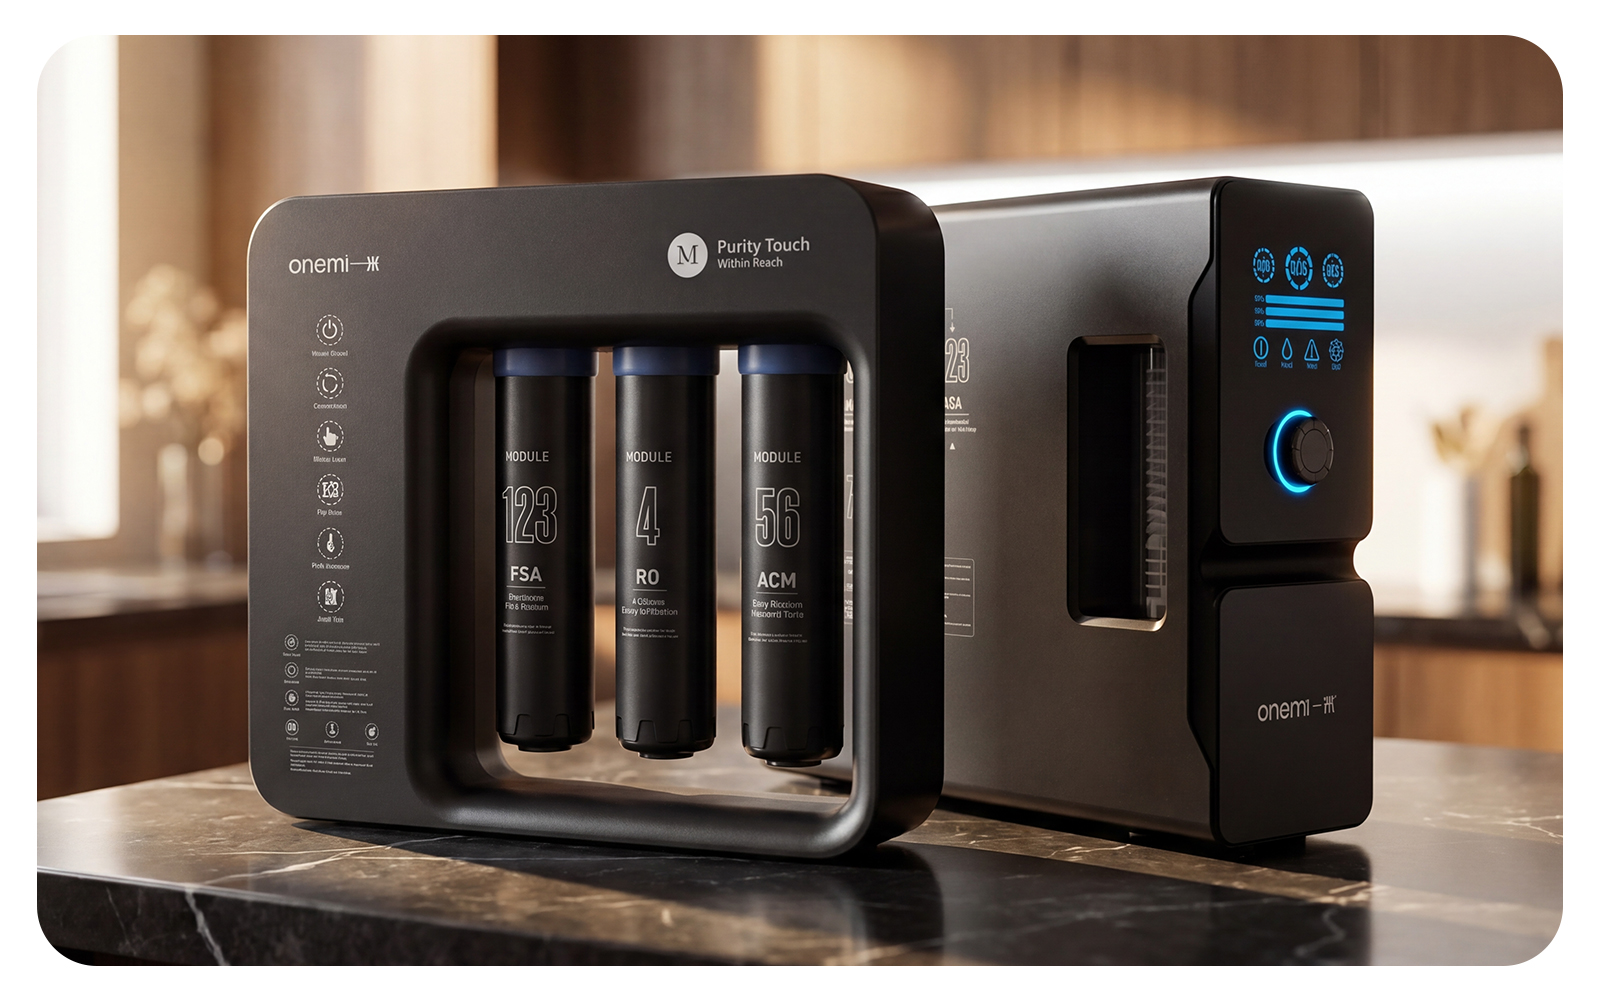
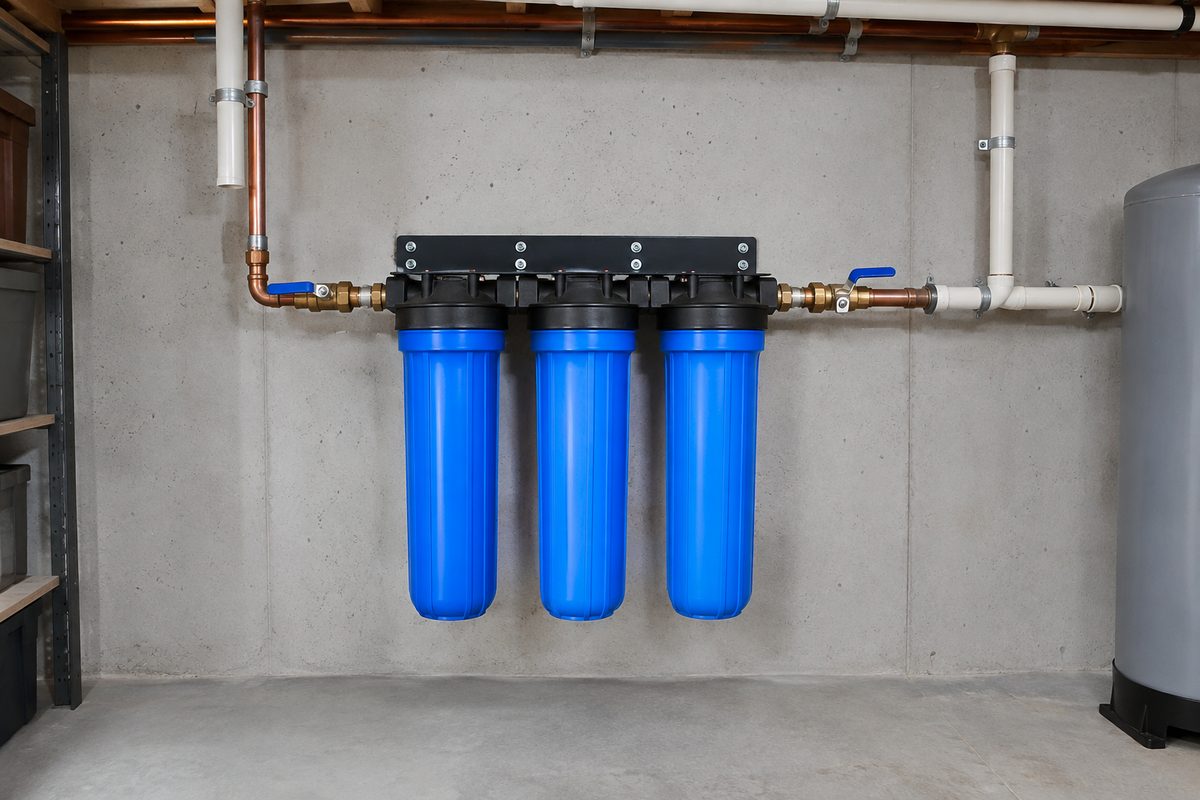
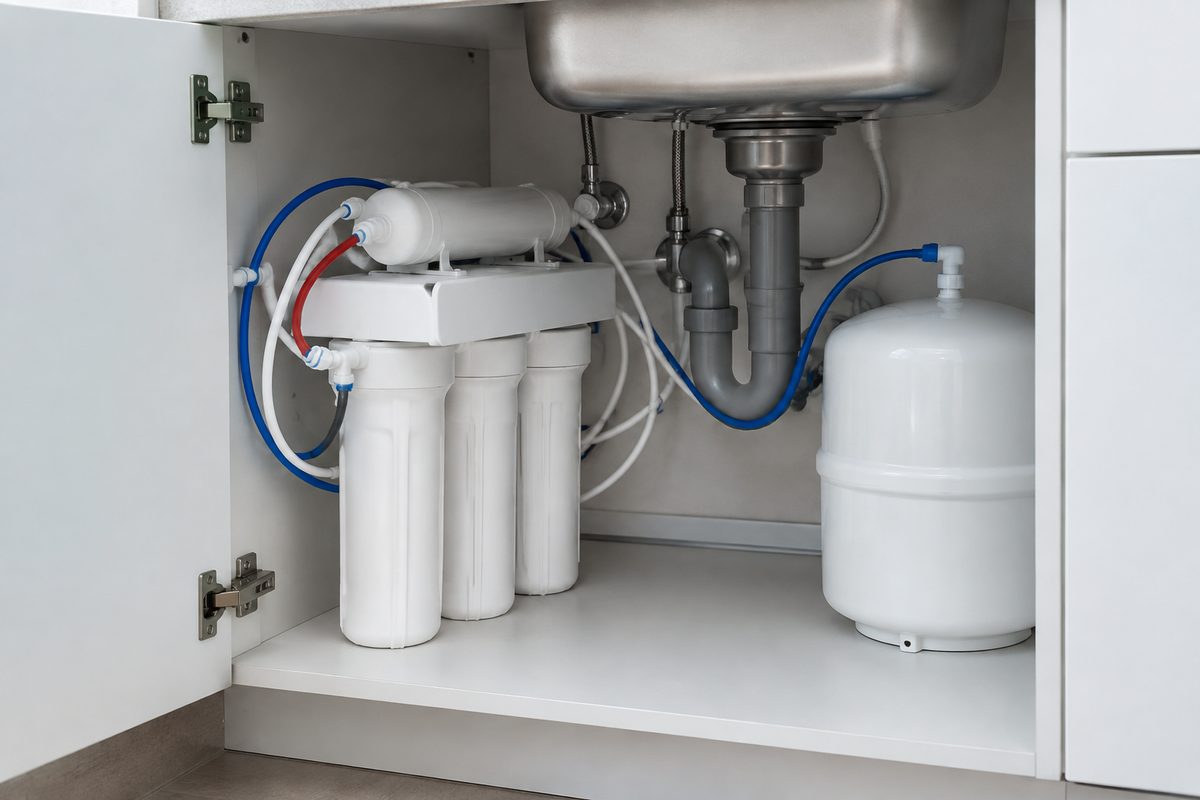
Point-of-use (POU) systems mount at a single connection, usually under the kitchen counter, and treat only the water a household drinks and cooks with. Point-of-entry (POE), or whole-house, systems sit on the main supply line and treat every gallon, including water for showers, laundry, and toilets.
The economic difference is not subtle. A POU unit is a $150-to-$600 appliance with a recurring cartridge stream. A whole-house system is a $700-to-$3,000 capital purchase that also carries a recurring media replacement schedule, but the unit itself lasts a decade. POU sells on volume and replacement cycles; POE sells on installation value and household protection.
That distinction shapes the sourcing decision, which the comparison in whole-house vs point-of-use water purification walks through in detail.
Market size: POU leads, whole-house compounds faster
Grand View Research sized the US point-of-use water treatment systems market at $4.52 billion in 2025, on a path to $8.18 billion by 2033 at a 7.76% CAGR. The same firm puts the US at 13.1% of the global point-of-use market, and expects the US to lead that global market in revenue by 2033.
Fortune Business Insights frames the global picture slightly differently, valuing the worldwide point-of-use market at $26.37 billion in 2025 and projecting $54.45 billion by 2034 at an 8.4% CAGR, with the US slice reaching about $7.55 billion by 2032.
The whole-house side is harder to pin to a single number because firms define the boundary differently, but the direction is consistent: MarketsandMarkets identifies the whole-house water treatment segment as the fastest-growing device category, at a 6.7% CAGR from 2026 to 2031.
| Segment | 2025 value | Forecast | CAGR | Source |
|---|---|---|---|---|
| US point-of-use treatment | $4.52B | $8.18B (2033) | 7.76% | Grand View Research, 2026 |
| Global point-of-use treatment | $26.37B | $54.45B (2034) | 8.4% | Fortune Business Insights, 2026 |
| Whole-house segment (global) | — | — | 6.7% (2026-31) | MarketsandMarkets, 2026 |
| Reverse osmosis technology | — | — | 7.4% (2026-31) | MarketsandMarkets, 2026 |
The takeaway from the table is the shape, not any single figure: point-of-use is the deep, mature pool; whole-house and reverse osmosis are where the compounding sits. An importer stocking only POU appliances is fishing the biggest pond but missing the fastest current.
Why POU dominates the US dollar
Point-of-use wins on replacement economics. Fortune Business Insights pegs replacement demand at roughly 42% of the US market, which means nearly half of every year’s revenue is a household swapping cartridges or upgrading an existing unit rather than buying their first system. That is annuity-style demand: predictable, non-discretionary, and resilient in a downturn.
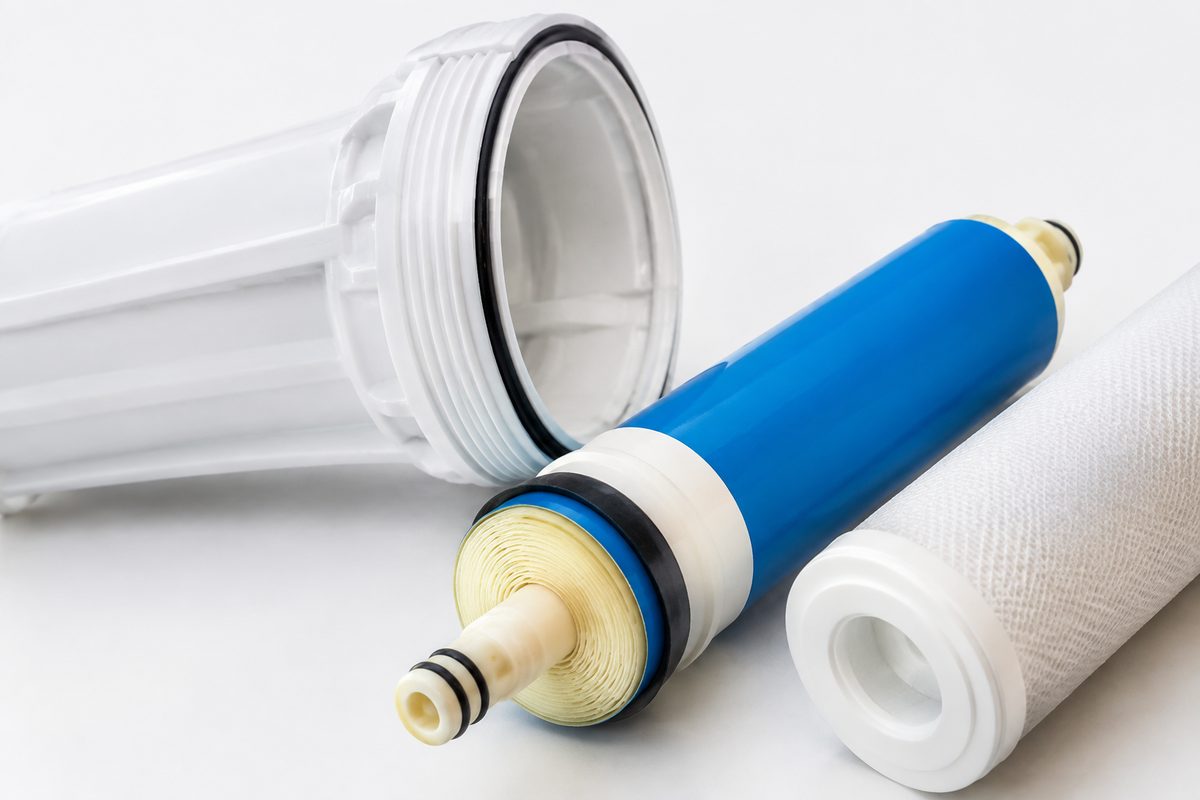
Under-sink reverse osmosis is the workhorse of that segment. RO accounts for the highest technology growth within point-of-use, at 7.4% through 2031, because it is the only point-of-use technology that removes dissolved contaminants like lead, nitrate, arsenic, and PFAS to the levels regulators now demand. Filtration methods, meaning carbon and sediment stages, remain the largest single technology segment by revenue.
For a manufacturer or importer, the POU play is a cartridge play. The appliance is the entry point; the recurring revenue is the filter. The US under-sink RO sourcing guide covers the compliance detail that determines whether a unit can even be listed in the US.
Whole-house’s 6.7% CAGR and what is driving it
The whole-house segment is growing faster because it is tied to the structural condition of US housing, not to consumer preference alone. The American Water Works Association estimates the drinking water infrastructure funding gap at $2.1 trillion to $2.4 trillion through 2050. The EPA’s 20-year needs assessment puts pipe replacement and repair at $625 billion, with lead service line replacement alone exceeding $100 billion.
Homeowners cannot wait for the municipality to fix the pipe under their street. A whole-house sediment filter or softener at the main line is the first line of defense against the rust, scale, and sediment that aging cast-iron and lead pipes deliver. That is why whole-house is compounding faster even though it is the smaller segment: the problem it solves is getting worse on a municipal timeline.
The US sediment pre-filter import guide explains why the pre-filter is the anchor product in a whole-house line, and how it pulls in the rest of the system.
The regulatory stack that moves both segments
Two federal actions are doing more than any marketing campaign to push US demand. The EPA’s 2024 PFAS rule set a 4 nanograms-per-liter limit on PFOA and PFOS in drinking water, and the Lead and Copper Rule Improvements lowered the lead action level from 15 to 10 parts per billion. Both convert an older installed base into a replacement pipeline, and both favor RO at the point of use and filtration at the point of entry.
The certification stack is the entry ticket for either segment. The relevant standards are NSF/ANSI 42 for aesthetic claims, 53 for health-effect claims including lead and PFAS, 58 for reverse osmosis systems, and 372 for lead-free materials. One scope rule trips importers repeatedly: whole-machine certifications for a water treatment unit cover CE, UL, FCC, and RoHS, while NSF applies to the filter cartridge rather than the complete appliance. A listing that claims whole-machine NSF certification is a compliance flag, not a selling point. The full mapping is in the NSF/ANSI 42 vs 53 vs 58 breakdown.
What the split means for an import strategy
The practical conclusion is that a US-facing line should carry both segments, but for different reasons. POU earns the recurring cartridge revenue and the steady replacement cycle. Whole-house earns the higher-ticket install and rides a faster growth curve. The two share the same certification groundwork, so the compliance investment is paid once and amortized across both.
ONEMI, a Guangdong-based water purification equipment manufacturer, runs its range on exactly this logic, with the whole-house sediment and softener systems covered in the whole-house filtration buying guide and the under-sink RO platforms on the product side. For an importer, the sequence that works is to anchor on a certified cartridge and a whole-house pre-filter, then expand into the RO and softening tiers once the compliance documentation is in place. The US residential market is splitting along two install points, and the margin sits on both sides of the meter.