

 한국어
한국어

- A typical residential RO unit rejects 3 to 5 gallons for every gallon of clean water it produces. A true 1:1 ratio roughly doubles membrane recovery, concentrating salts on the surface and cutting element life.
- Conventional industrial RO recovers about 75% of feedwater. Engineered high-recovery systems reach 85–95% using recirculation, flow-reversal, or ultra-high-pressure elements plus continuous antiscalant dosing.
- NSF/ANSI 58 requires at least 75% TDS removal and now tests recovery efficiency, so a 1:1 claim without that test documentation is unverified.
- Zero-waste is moving from marketing phrase to engineering practice: EPA’s Water Reuse Action Plan 2.0 and $251 million in 2026 WIFIA funding are pushing high-recovery RO into power, data-center, and municipal reuse.
A 1:1 pure-to-waste ratio sounds like the responsible choice, and in most residential systems it is also a warning sign. Squeezing twice as much clean water out of the same membrane does not happen for free. It happens by driving up the concentration of dissolved solids on the membrane surface, and that is where scale, fouling, and shortened element life come from. Buyers who treat “1:1” as a feature without understanding the tradeoff are buying a number, not an engineering decision.
The market momentum behind high-recovery reverse osmosis is real and accelerating through 2026. What matters for anyone sourcing these systems is knowing how the recovery is achieved — and what it does to operating cost over the life of the equipment.
What recovery rate actually measures
Recovery is the percentage of feedwater that becomes product water. The rest leaves as concentrate, the brine stream that carries rejected salts away from the membrane. A conventional residential under-sink unit running near 1:3 recovers about 25% of the water it draws. An industrial system designed for reuse typically recovers around 75%. The two numbers describe the same physical process at very different points on a curve.
That curve is not flat. As recovery rises, the salt concentration in the concentrate stream rises with it, because the same load of dissolved solids is now being pushed into a smaller and smaller volume of water. The membrane is not removing salt from the whole stream; it is partitioning water through while the rejected solids pile up on the feed side. Push recovery too high and those solids start precipitating onto the membrane surface as scale.
This is why the RO membrane vs UF membrane comparison matters for sourcing: reverse osmosis is the only common technology that generates a concentrate stream at all, so it is the only one where recovery management is a daily operating concern.
Why 1:1 is harder than it looks
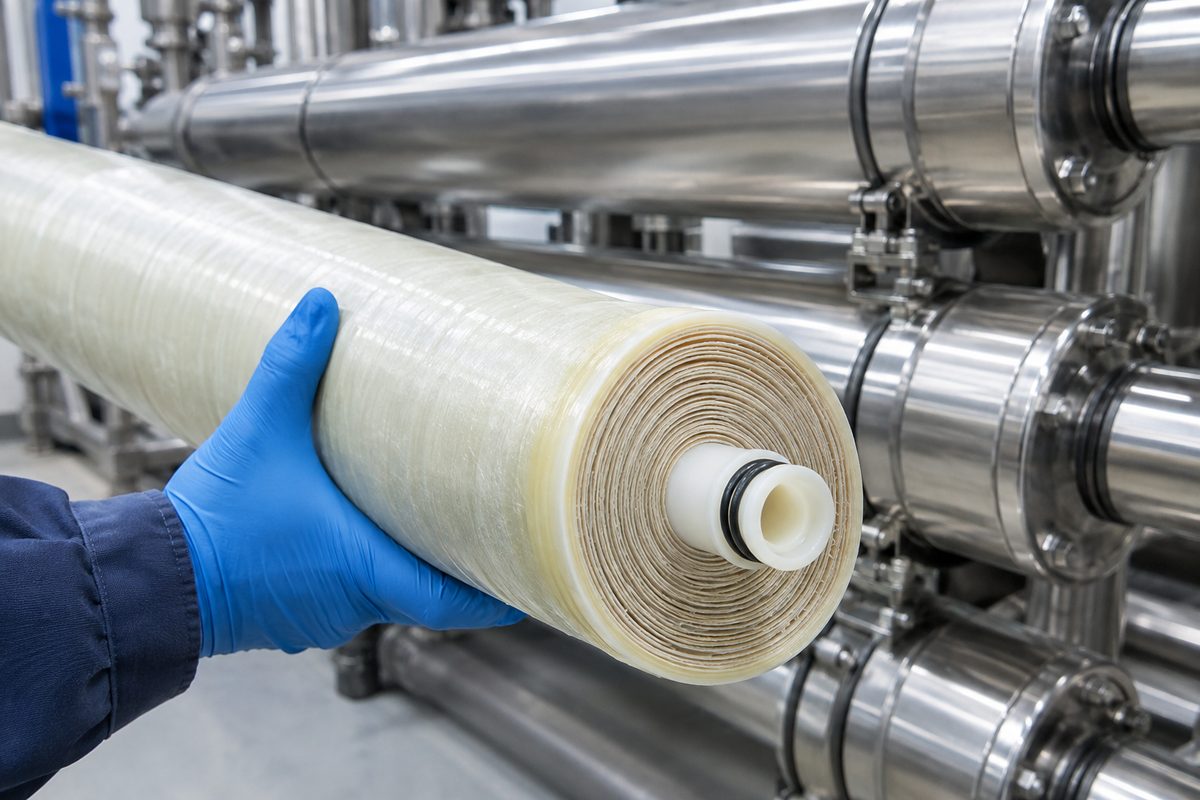
The engineering problem is concentration polarization. Dissolved minerals and organics build up in the thin layer of water immediately against the membrane, far above the bulk concentration of the feed. A system designed for 1:2 has enough crossflow to sweep that layer away. A system pushed to 1:1 does not, unless the designer compensates with more membrane area, higher crossflow, antiscalant, or a staged configuration — all of which add cost and complexity that a cheap “1:1” unit rarely includes.
What a buyer actually gets with an under-engineered 1:1 unit is predictable: rising pressure drop, falling flux, and a membrane that scales or fouls months earlier than the datasheet suggests. The water bill savings are real but small. A family of four drinking two gallons a day at 1:3 sends about eight gallons to drain — roughly the volume of a single toilet flush. The savings from moving to 1:1 do not justify an element that fails a year early.
None of this means high recovery is a bad idea. It means high recovery has to be earned through design, not printed on a spec sheet. That distinction is the whole story of where the technology is going in 2026.
How high recovery is actually achieved
Three design approaches are doing the real work, and all three are moving from pilot projects into production orders. The first is flow-reversal: periodically reversing the direction of the concentrate flow so that scaling-prone areas are flushed by the previous direction’s tail water. The second is batch and semi-batch operation, which runs the membrane in short pressurization cycles with periodic flushing instead of continuous flow, letting a system recover well past the point where a continuous design would scale. The third is ultra-high-pressure elements that keep pushing water through at brine concentrations that would stall a standard 400-psi element.
Each approach trades something. Flow-reversal adds control complexity and some product-water loss on every reversal. Batch operation adds a pressure-exchange or bladder stage and a more demanding control loop. Ultra-high-pressure elements raise energy cost per gallon and demand heavier pressure vessels and piping. The table lays out the tradeoffs a sourcing team should map against the feedwater they actually have.
| Approach | Typical recovery | What it buys | What it costs |
|---|---|---|---|
| Standard continuous RO | ~75% | Simplicity, lowest capex | Largest brine volume to dispose |
| Flow-reversal RO | 85–90% | Scaling resistance on difficult water | Valving, controls, small product loss per reversal |
| Batch / semi-batch RO | 85–95% | Highest recovery, works past saturation | Pressure-exchange stage, demanding controls |
| Ultra-high-pressure elements | 90%+ | Concentrates brine for near-ZLD | Energy cost, heavier vessels and piping |
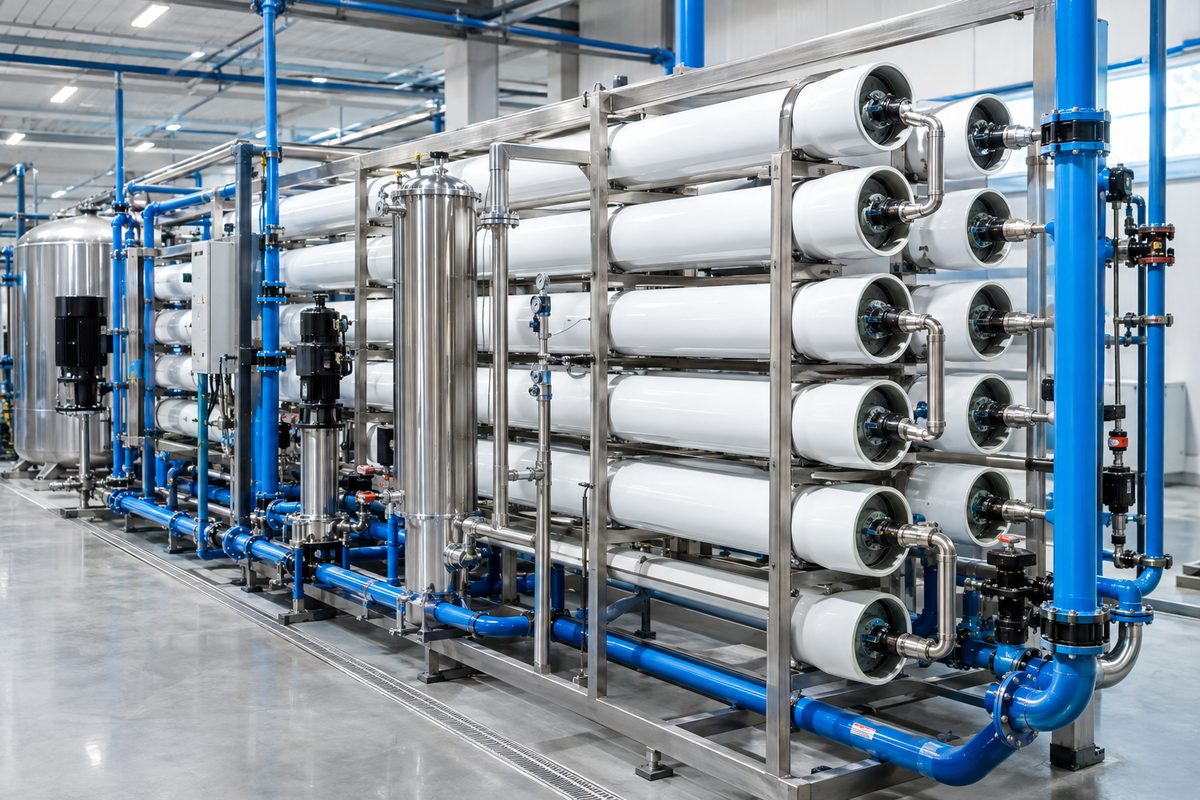
For a manufacturer and its OEM buyers, the practical consequence is that “high recovery” is now a design parameter, not a badge. The zero-waste RO systems guide walks through how these configurations are being packaged for commercial and industrial buyers who care about brine disposal costs more than the water bill.
Where zero-waste is actually landing
The serious adoption is happening in industrial and municipal reuse, not in kitchen sinks. California is the clearest example. In April 2026 the EPA launched its Water Reuse Action Plan 2.0, and in September it closed a $251 million WIFIA loan to the Las Virgenes-Triunfo authority in southern California to advance a potable reuse project serving 105,000 customers. That money is buying high-recovery membranes, not gravity filters.
Power generation and data centers are the quiet second wave. Both use enormous volumes of cooling water and both face tightening discharge rules, which makes recovering that water on site cheaper than hauling it or paying discharge penalties. A peer-reviewed pilot published in 2025 in npj Clean Water pushed recovery from an Arizona desalting plant’s concentrate stream to 82.6% using batch operation, producing 150 ppm product water from 6,400 ppm brine without scaling. That is the direction of travel: recovery is climbing past the old limits because the alternatives — disposal cost, discharge permits, water scarcity — are getting more expensive faster than the engineering is getting harder.
The contrast with the consumer market is instructive. Where a residential buyer sees “1:1” as a green checkbox, an industrial buyer sees a recovery curve, a concentrate disposal bill, and an element replacement schedule. The same membrane physics, two very different purchase logics.
What OEM buyers should verify
Three checks separate a genuine high-recovery system from a marketing claim. First, demand the recovery test data against a stated feedwater composition — recovery is meaningless without the TDS, hardness, and silica load it was validated against. Second, ask for the NSF/ANSI 58 documentation if the unit is marketed for drinking water; the standard requires at least 75% TDS removal and has added recovery-efficiency testing, so a 1:1 claim without that paperwork is unverified. Third, price the total cost of ownership: a higher-recovery unit that scales and needs an element swap every six months is more expensive over three years than a 1:2 unit that runs clean.
The RO vs UF vs NF membrane comparison and the tankless RO market forecast give the broader context on where membrane and system economics are heading, but the core question stays the same: recovery is a number you earn, not a number you print.
Where ONEMI sits on the curve
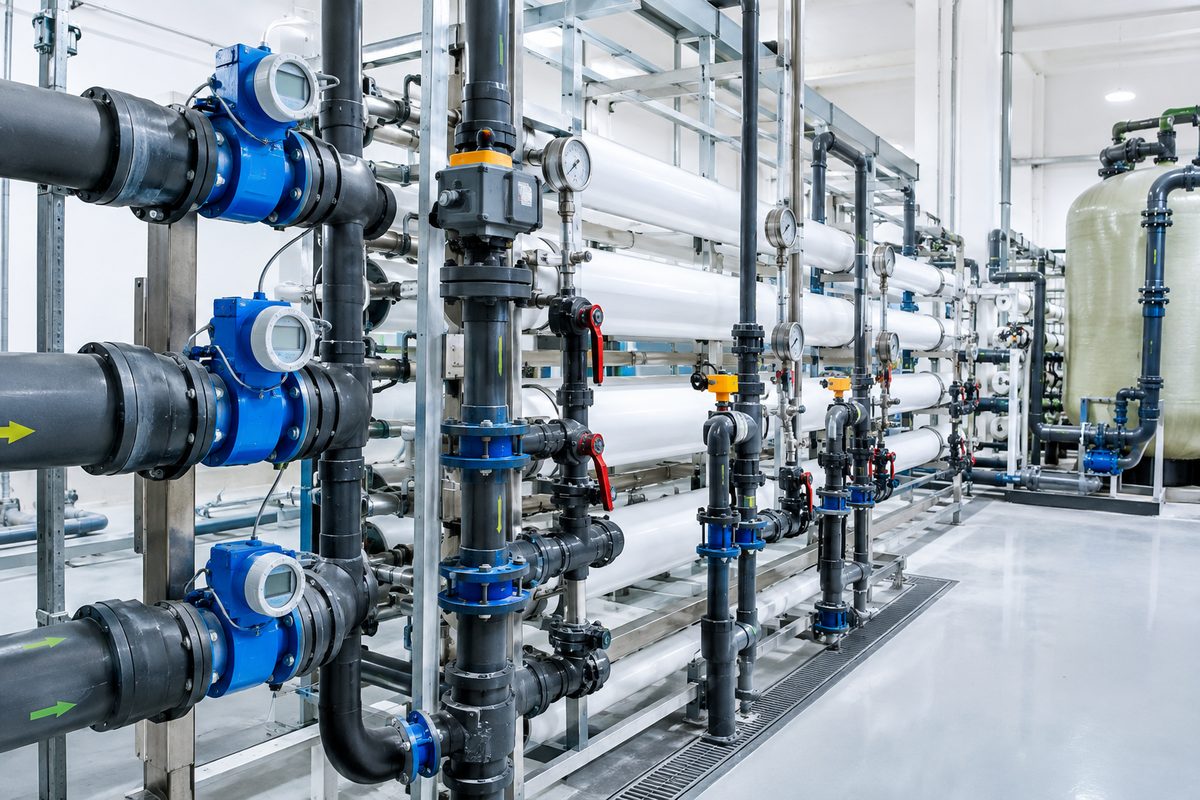
ONEMI, a Guangdong-based water purification equipment manufacturer, builds tankless high-capacity RO platforms and cartridge lines that map onto this exact shift. The engineering focus is on the elements that determine real recovery performance — membrane selection, flow-restrictor and brine-line design, and staged configurations — rather than on a single printed ratio. For OEM and private-label buyers, that means the recovery specification is delivered with the feedwater conditions and test data behind it, which is the only way a number like 1:1 or 85% means anything at all.
High-recovery and zero-waste RO will keep climbing through 2026 and beyond, driven by water scarcity, discharge regulation, and the economics of reuse. The systems that win are the ones where the recovery number is backed by engineering you can audit, not a sticker you can peel off.