



 한국어

- EPA’s drinking water needs survey puts 20-year infrastructure demand at $625 billion, with lead service line replacement alone topping $100 billion — a structural tailwind POU filters will ride for a decade or more
- The global point-of-use water treatment market is projected to grow from $34.5 billion in 2025 toward $67.8 billion by 2033, roughly an 8.9% CAGR, with aging municipal pipes repeatedly cited as a core driver
- For importers and brand builders, the play is not “sell a filter” but “sell the last line of defense” — and the recurring cartridge revenue that comes with it
The most reliable demand driver in the water treatment business right now isn’t a new membrane or a smarter sensor. It’s a hundred years of buried pipe.
Municipal water systems across North America and Europe are quietly failing. The treatment plants still do their job at the source. But the water that leaves the plant clean has to travel through distribution networks that, in many cities, date back decades — and it picks up lead, rust, and sediment along the way. That gap between “safe at the plant” and “safe at the tap” is exactly where point-of-use filtration lives. And it is widening.
For importers, OEM partners, and private-label brands, this is the macro trend worth building a catalog around. Here is the data behind it, and what it means for sourcing decisions in 2026 and beyond.
The infrastructure numbers that matter
Start with the scope. The U.S. EPA’s Drinking Water Infrastructure Needs Survey and Assessment estimates the country will need roughly $625 billion in drinking water infrastructure investment over 20 years. Of that, more than $422 billion is for pipe replacement and rehabilitation alone. Lead service line replacement is its own line item, north of $100 billion under the Lead and Copper Rule.
The American Water Works Association puts the long-range figure even higher — $2.1 trillion to $2.4 trillion needed through 2050 to maintain and replace the nation’s drinking water systems. That is not a typo. That is the price of deferred maintenance finally coming due.
The practical consequence: utilities will be digging up and replacing pipe for decades, and in the meantime, the water reaching homes will keep carrying the byproducts of that aging network. Around 63% of water treatment facilities are already past their intended service life, and more than 20% of public water systems have been cited for violations of the Safe Drinking Water Act in a given year. None of this gets fixed quickly.
Why this converts directly into POU demand
Point-of-use filtration is the only water quality intervention the end user controls. A utility can replace a lead service line at the curb, but the homeowner can’t speed that up — and the water inside the home’s own plumbing is still the homeowner’s problem. The under-sink RO system or countertop filter is the only layer a family can install today, regardless of what the city does tomorrow.
That’s why market analysts keep landing on aging infrastructure as a primary driver. The global point-of-use water treatment systems market is projected to grow from about $34.5 billion in 2025 to $67.8 billion by 2033, an 8.9% CAGR, according to Grand View Research. North America holds a commanding share — roughly 27% of global revenue in 2025 — with concerns over aging municipal water infrastructure cited as a leading regional growth driver.
The filter cartridge side of the business compounds this. Filters are consumables. Every system sold today generates a replacement cycle for years afterward, which is why the broader water purifier filter market is tracking a 6.5% CAGR through the early 2030s. Infrastructure-driven first-time installs and recurring cartridge replacements are two gears turning the same machine.
The lead angle: regulation as a demand accelerant
Lead is the most visible symptom of infrastructure decay, and regulation is amplifying it. The EPA has been rolling out billions in Drinking Water State Revolving Fund money specifically for lead service line replacement — over $2.9 billion in 2026 alone, distributed state by state. Every announcement naming a specific state’s allocation is effectively free market education: it tells homeowners in that state that their pipes might be a problem, which is the moment they start shopping for a filter.
For a brand or importer, lead-related searches and lead-certified products are a defensible entry point. NSF/ANSI 53 and 58 certifications for lead reduction are table stakes in the U.S. market now. An under-sink RO system with documented lead reduction is not a niche product; it’s the default answer to a problem the federal government is spending billions to publicize. For a deeper look at certification requirements, see the NSF and PFAS sourcing guide for under-sink RO.
What this means for sourcing strategy
If you’re building a private-label line or stocking inventory for a regional market, the aging-infrastructure thesis points to a few concrete moves.
First, lead and sediment reduction should anchor the product story. A multi-stage under-sink RO system that clears lead, rust, and sediment speaks directly to the aging-pipe problem in a way a plain carbon filter cannot. This is where the margin and the differentiation both live.
Second, position the system as a defense layer, not a luxury. The customer isn’t buying a gadget; they’re buying protection against a pipe network they can’t see and don’t control. That framing supports a higher price point and a stronger brand.
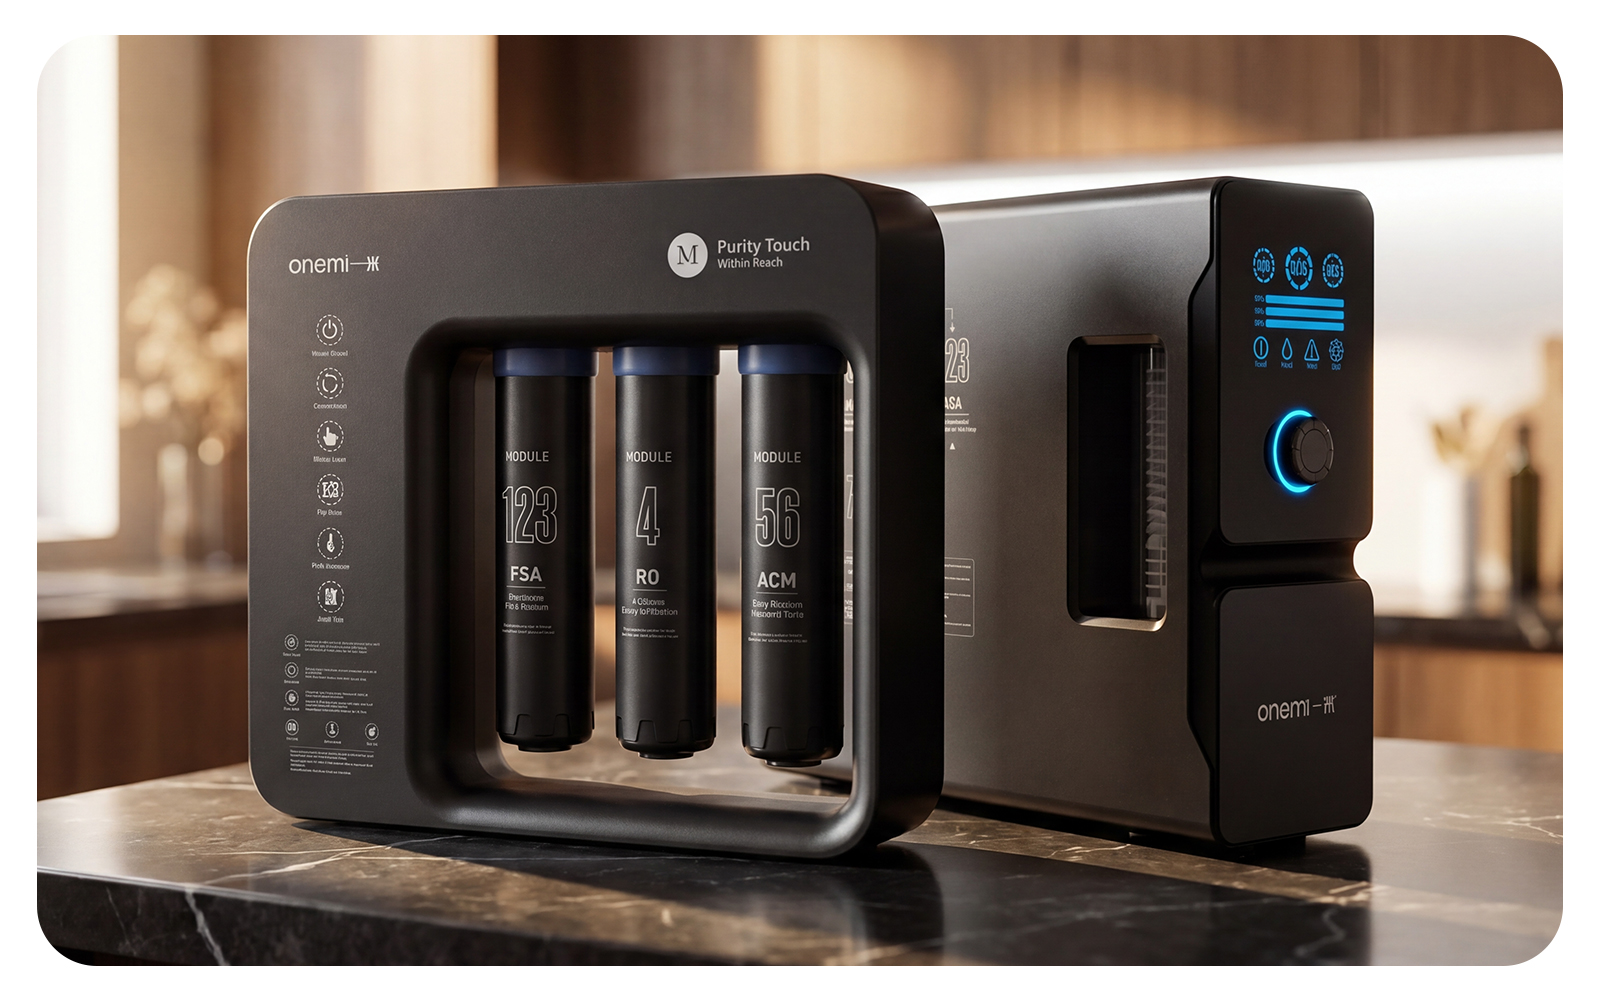
Third, structure around the cartridge. The hardware sale is a one-time event; the cartridge is the annuity. Buyers who understand the infrastructure angle understand that demand is durable, which makes multi-year cartridge contracts and subscription models easier to sell. ONEMI, a Guangdong-based water purification equipment manufacturer, builds its OEM programs around exactly this structure — hardware plus a cartridge pipeline that keeps the channel profitable after the first install. More on the recurring-revenue logic in the cartridge sourcing and recurring revenue guide.
Regional read: where the tailwind is strongest
Not every market is equally exposed. North America is the most direct play — aging pipe stock, active lead regulation, and high consumer spending on health all converge there. The U.S. alone accounted for roughly 21% of global POU market share in 2025, and that share is being defended by exactly the infrastructure problems this article describes.
Europe is a close second, driven less by lead and more by microplastics and PFAS concerns layered on top of older municipal systems. The broader point for a sourcing team is that the demand signal is durable across both markets, even if the specific contaminant story shifts. A catalog built around “aging infrastructure defense” can flex from lead in the U.S. to PFAS and microplastics in Europe without changing the underlying hardware.
For importers sizing up where to place inventory and which OEM programs to commit to, the aging-infrastructure trend is one of the few demand drivers in this industry that is backed by hard capital budgets — the billions already committed to pipe replacement, and the trillions projected over the next quarter century. Filters don’t fix the pipes. But they own the waiting period. And the waiting period is going to be long.
For a wider view of how this fits the global market trajectory, see the 2026 market analysis on Asia-Pacific and global growth and the RO market trends outlook for 2026.