
 한국어
한국어

Executive Summary
- China exported $6.8 billion in water filtration equipment in 2025, up 11.2% year-over-year, with modular cartridge shipments overtaking complete units for the first time.
- The EU’s Carbon Border Adjustment Mechanism (CBAM), effective July 2025, now requires importers to provide lifecycle carbon footprint data for water purification equipment — adding 8-12% to compliance costs.
- RO membrane self-sufficiency in China reached 52% in 2025, narrowing the gap with Japanese and German suppliers and reshaping OEM pricing structures across Southeast Asia and the Middle East.
If you buy water filtration equipment, the numbers have shifted. China’s water purification exports hit $6.8 billion in 2025. That’s 11.2% growth in a single year. Modular filter cartridges have crossed a threshold — for the first time, they account for more export volume than fully assembled units. The supply chain is restructuring, and importers who understand the new math are the ones capturing margin.
This isn’t a market overview. It’s a sourcing framework built on export data, compliance timelines, and factory-floor realities in Guangdong’s water purification manufacturing cluster.
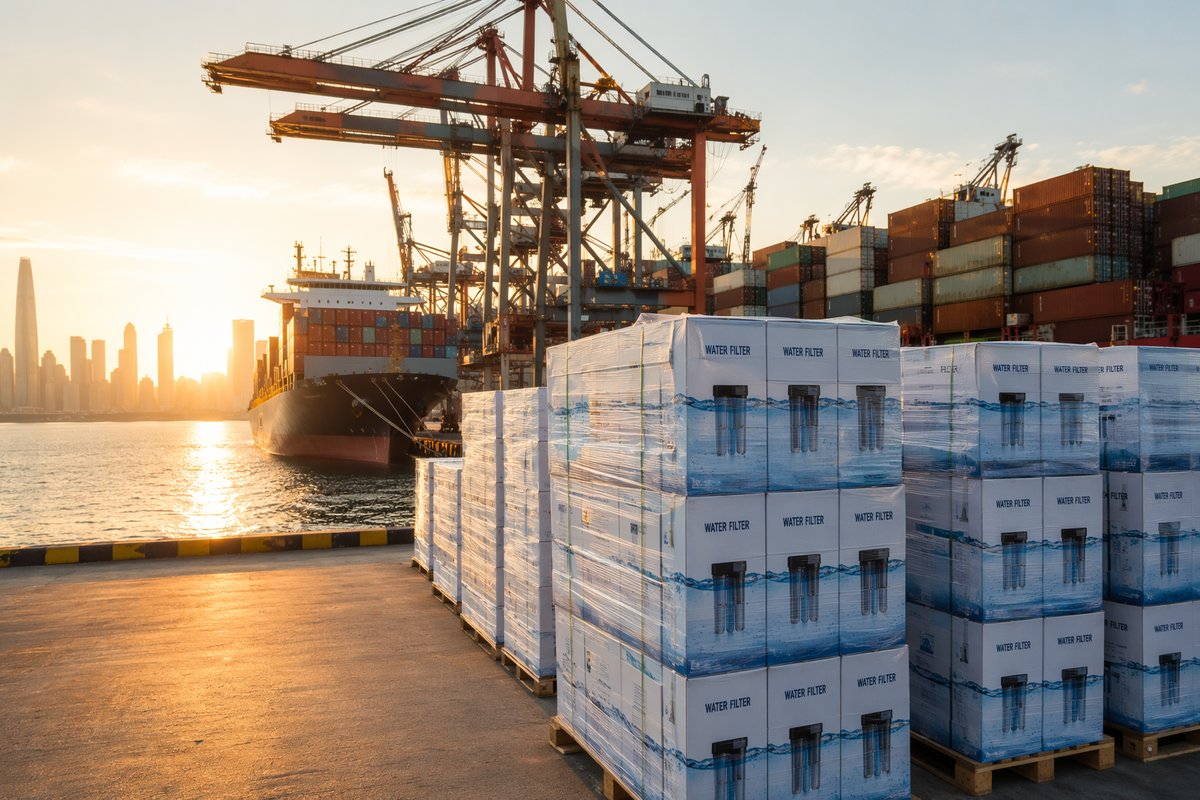
The Export Numbers That Matter for Procurement Planning
Start with the aggregate: the global water filtration market sat at roughly $89.6 billion in 2025, according to GEP Research. It’s tracking toward $128 billion by 2030 at a compound annual growth rate hovering near 6.5%. Asia-Pacific accounts for over $51 billion of that in 2026 — and China is the engine.
But aggregate numbers hide the procurement-relevant signals. Here’s what actually affects your landed cost and lead time:
Destination concentration is shifting. The EU remains the largest single destination for Chinese water filtration exports, but Southeast Asia and the Middle East are growing faster. China’s exports of multimedia filters and reverse osmosis membrane modules to the Middle East jumped 41% year-over-year in 2025, driven by seawater desalination pretreatment demand. For importers serving markets like Saudi Arabia, UAE, or Qatar, this means more supplier competition — and more negotiating leverage.
Cartridge exports have overtaken complete units. This is a structural change, not a blip. The modular filter cartridge format — standard 10-inch housings, quick-connect fittings, drop-in designs — now represents the majority of export volume. Why it matters: importers can now source filter consumables and housings separately, mix-and-match from different suppliers, and handle final assembly or branding in-country. It’s a margin play with real logistics implications.
Membrane self-sufficiency is reshaping pricing. In 2020, only 21% of RO membrane elements used by Chinese manufacturers were domestically produced. By 2025, that number hit 52%. The import dependency for membranes and pumps has dropped to 18%. For procurement managers, this translates to shorter lead times on Chinese-made RO systems and downward pressure on pricing — especially for residential under-sink units in the 50-100 GPD range.
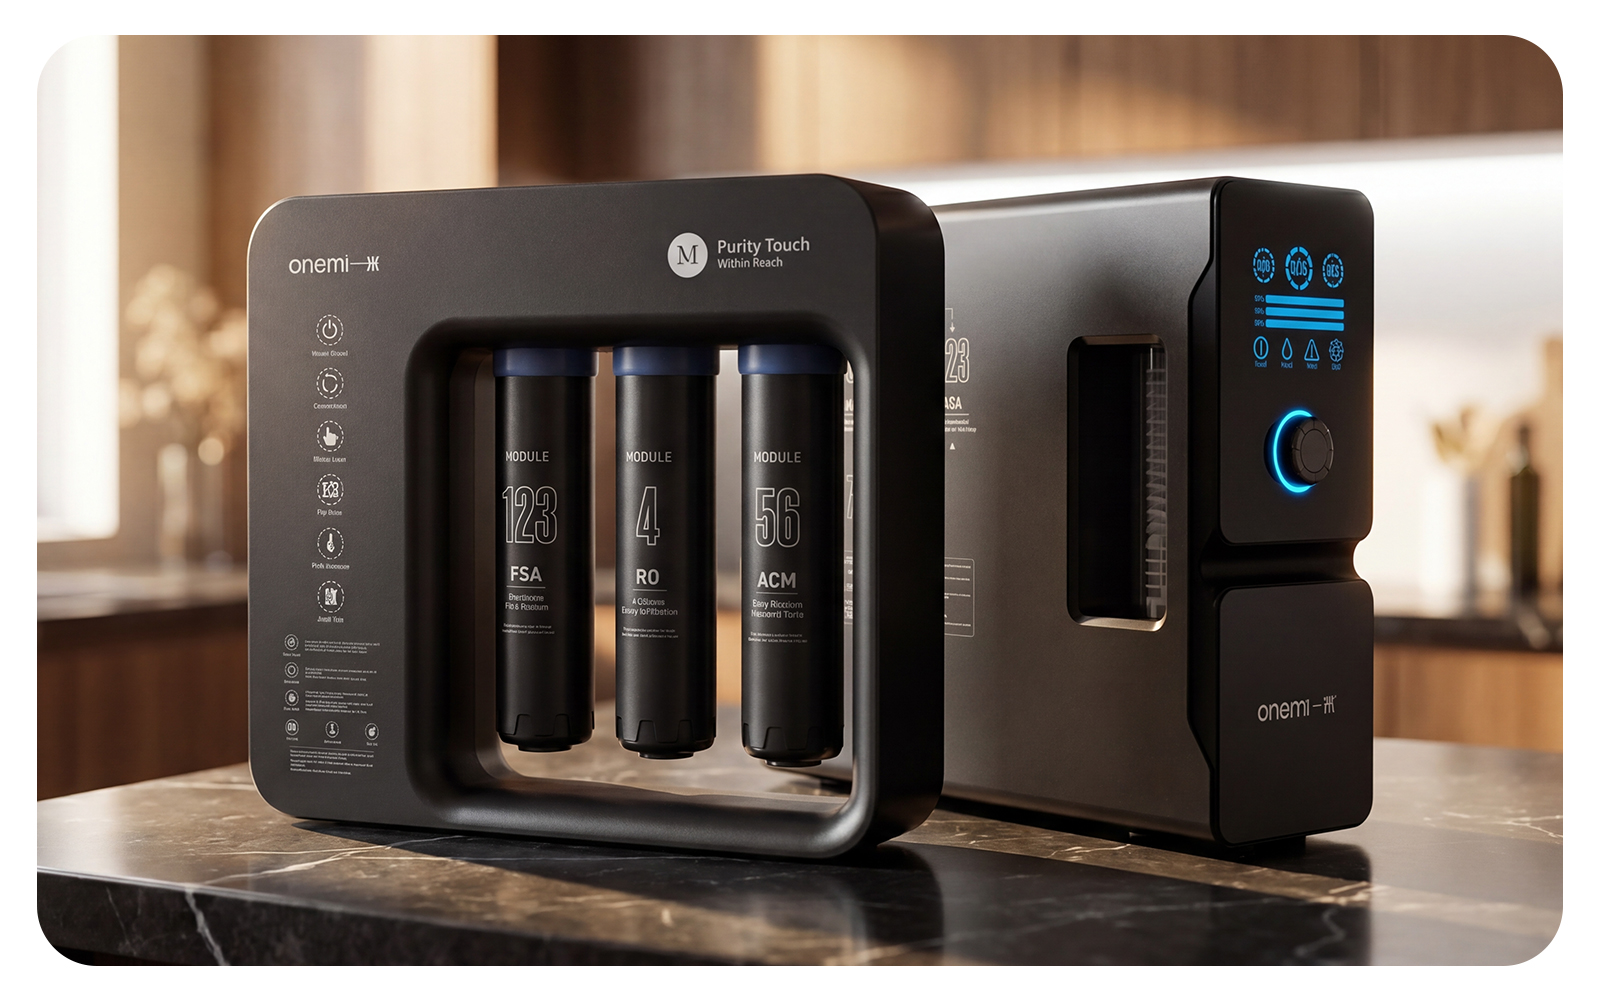
ONEMI’s OEM factory in Dongguan, Guangdong operates within this supply chain shift. The facility runs production lines that handle both complete RO system assembly and modular cartridge manufacturing, giving importers the flexibility to order finished units or component-level shipments depending on their in-country assembly strategy.
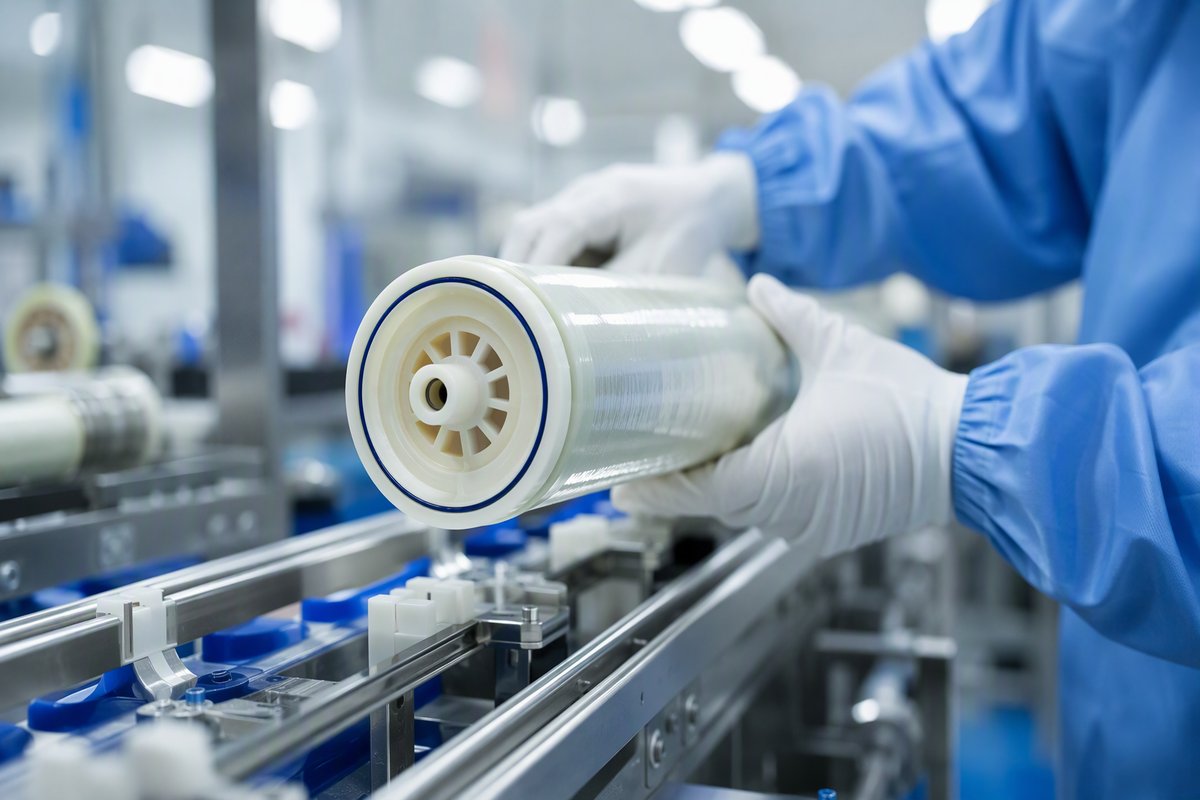
Compliance: What Changed in 2025 and What’s Coming
Regulatory friction is the fastest-growing line item in any import budget. Three developments in the past 18 months have changed the compliance calculus for water filtration importers:
EU Carbon Border Adjustment Mechanism — Now Active for Water Equipment
As of July 2025, the EU’s CBAM applies to imported water purification equipment. Importers must now provide cradle-to-gate carbon footprint data for each shipment. GEP Research estimates this adds 8% to 12% to compliance costs for manufacturers who haven’t invested in recycled material housings and low-energy production processes.
What this means in practice: if your Chinese supplier can’t produce a verified lifecycle assessment, your landed cost in Rotterdam or Hamburg goes up by a double-digit percentage. The suppliers who invested early — switching to recycled ABS for filter housings, installing solar at their production facilities, documenting energy consumption per unit — now have a pricing advantage. Ask for their CBAM compliance documentation before you request a quote.
NSF/ANSI Certification — Still the Gatekeeper for North America
The NSF/ANSI 42, 53, and 58 standards remain non-negotiable for the US and Canadian markets. What’s new: testing backlogs at NSF International have shortened from 14-16 weeks in 2024 to 8-10 weeks in 2026, reducing the certification lead time for new product introductions. However, the cost of full-system certification (typically $15,000-25,000 per model) hasn’t moved.
For importers launching private-label brands, the practical path is to work with manufacturers who already hold NSF certification on their core platform and who can extend certification to private-label variants under the same production line audit. This cuts time-to-market from six months to roughly eight weeks. ONEMI holds NSF/ANSI 42 and 53 certification on filter cartridges used across multiple OEM platform designs, with CE, UL, FCC, and RoHS covering complete systems.
Country-Specific Certification Traps
Don’t assume CE covers all of Europe. The UK now requires WRAS (Water Regulations Advisory Scheme) approval for any product connecting to the mains water supply. Australia demands WaterMark certification under AS/NZS 4348 — a common point of failure for first-time importers who assume NSF equivalency. Saudi Arabia’s SASO has tightened water contact material testing requirements for 2026 imports.
The rule: before you place a container order, map the certification matrix for every country in your distribution footprint. A single missing certificate can hold a $40,000 shipment at customs for three months.
Verify certifications at ONEMI’s certification page before committing to a supplier relationship.
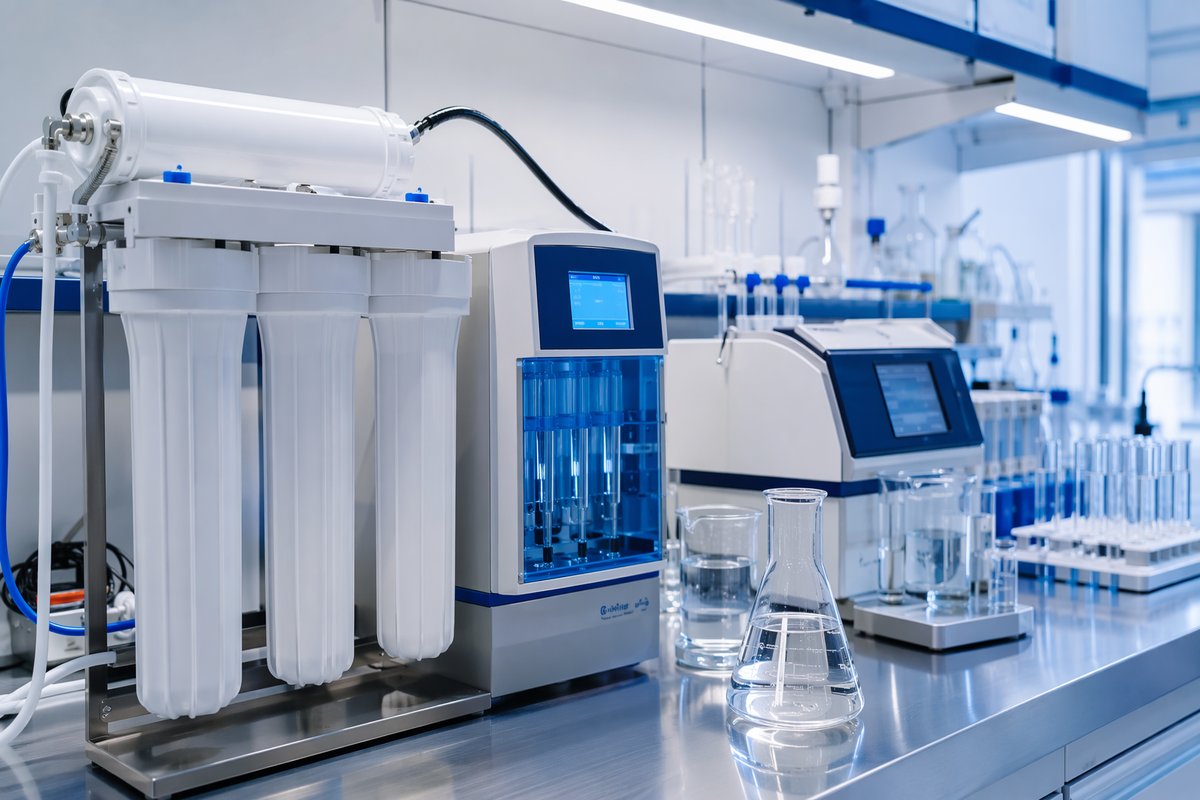
Cost Structure: Where Your Money Goes
Procurement managers who understand cost breakdown negotiate from data, not instinct. Here’s the approximate cost split for a mid-range under-sink RO system sourced from Guangdong in 2026, FOB Shenzhen:
| Component | Share of FOB Cost | Key Variable |
|---|---|---|
| RO membrane element | 22-28% | Domestic vs. imported; 50/75/100 GPD rating |
| Pump + power supply | 15-20% | Booster pump brand; 24V DC vs. 36V DC |
| Filter housings + cartridges | 18-22% | Material (PP vs. reinforced ABS); stage count |
| PCB + solenoid valves + fittings | 12-16% | Smart vs. basic controller; valve brand |
| Packaging + manual + labeling | 5-8% | Retail box vs. bulk; multi-language manual |
| Labor + factory overhead | 10-14% | Automation level; production volume |
Two cost levers worth watching in 2026: domestic RO membrane pricing is softening as production capacity expands, while packaging costs are rising due to EU recycled-content mandates. Adjust your negotiation strategy accordingly — push harder on the membrane line item and accept the packaging increase as a compliance cost you can’t avoid.
Sea freight from Shenzhen/Yantian to major ports: $2,800-3,500 per 40-foot container (Rotterdam), $1,800-2,400 (LA/Long Beach), $800-1,200 (Jebel Ali). These are Q1 2026 spot rates — contract rates typically run 15-20% lower for importers moving 10+ containers annually.
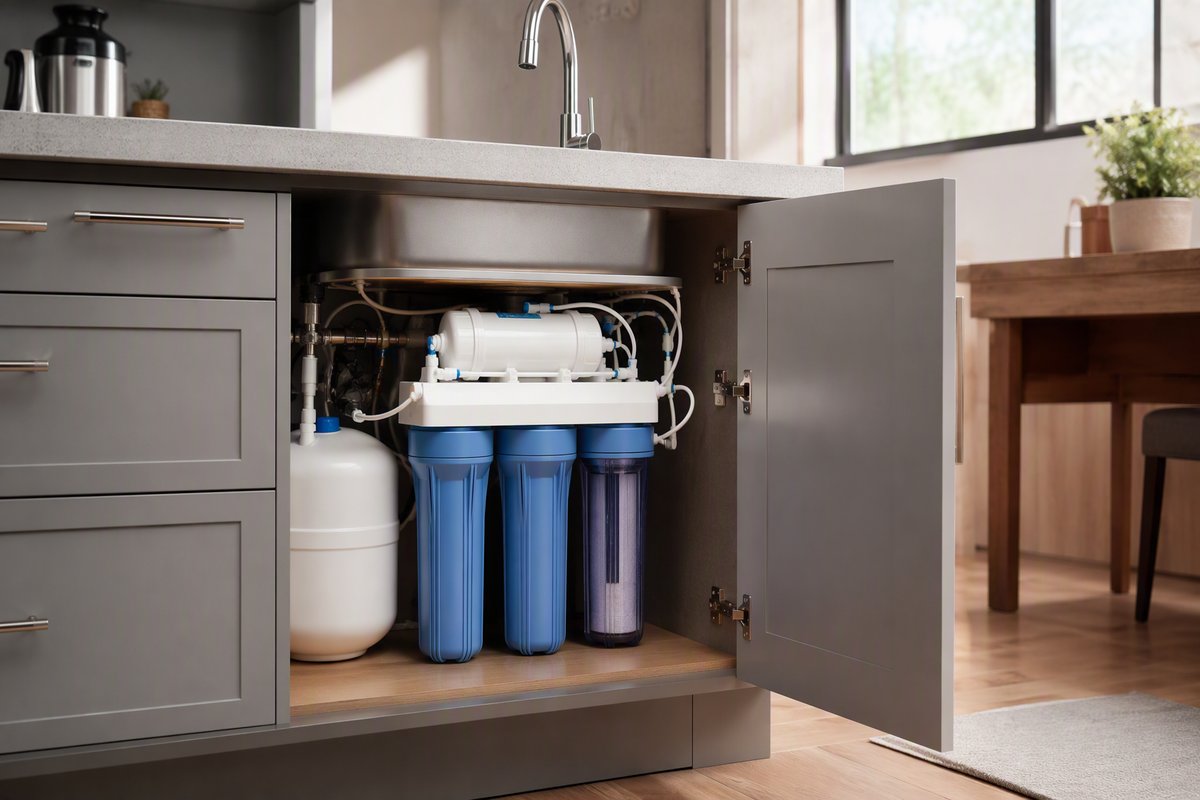
Supplier Qualification: What to Check Before Sending the PO
A factory visit is ideal. A structured qualification checklist is practical. Here’s what separates a production-ready OEM partner from a trading company with a factory address:
Production floor reality check. Ask for a live video walkthrough of the production line — not a pre-recorded tour. Look for: in-line testing stations (each unit should be pressure-tested and leak-checked before packaging), aging test racks (RO systems should run for 4-8 hours of burn-in testing), and a dedicated QC area with water quality testing equipment (TDS meters, pH meters, chlorine test kits). If they’re assembling RO systems without a TDS meter visible on the QC bench, find another supplier.
Membrane sourcing transparency. A manufacturer who won’t tell you whose membrane they’re using is hiding something. Acceptable answers: “We use Vontron membrane elements” (China’s largest domestic producer), “We offer both domestic and imported options depending on your target market,” or “We manufacture our own wound membrane elements — here’s our production line.” Unacceptable: “Don’t worry about it.”
Certification audit trail. Don’t accept a scanned certificate. Verify it: for NSF, check the NSF online listing by manufacturer name and model number. For CE, request the Declaration of Conformity and the notified body number. For RoHS, request the third-party lab test report — not just the supplier’s self-declaration. A legitimate manufacturer will have these documents organized and ready. A reseller will stall.
ONEMI’s Classic series and Flagship RO systems are produced on dedicated assembly lines with in-line pressure testing and burn-in aging for each unit. Documentation packages — including NSF listings, CE declarations, and RoHS lab reports — are maintained per production batch.
MOQ, Lead Time, and the Realities of Customization
Minimum order quantities are dropping. Five years ago, a custom-branded RO system required 500-1,000 units to justify production setup. In 2026, many Guangdong manufacturers accept 100-200 unit MOQs for private-label orders using existing platform designs. The trade-off: per-unit cost is 12-18% higher at 100 units than at 500 units, and lead time stretches from 25 days to 35-40 days because the factory batches smaller orders together.
Customization levels to understand:
Level 1 — Branding only: your logo on the front panel, your branding on the manual and packaging. Fastest turnaround (20-25 days), lowest MOQ (100 units), minimal cost adder ($1.50-3.00 per unit for panel printing).
Level 2 — Branding + enclosure color: custom housing color (beyond standard white/black), custom panel layout. Requires new mold or spray-paint batch. MOQ 200-300 units, 30-40 days lead time, $4-8 per unit adder.
Level 3 — Platform modification: changing filter configuration (e.g., adding a mineral cartridge stage, swapping GAC for catalytic carbon), modifying the PCB control logic, changing pump specifications. MOQ 300-500 units, 45-60 days lead time. Requires engineering review and compliance re-certification.
Standard lead times from Guangdong factories in 2026: 20-25 days for stock-platform orders with branding only; 30-40 days for custom enclosure variants; 45-60 days for platform modifications. Add 18-25 days sea freight to the US West Coast, 25-32 days to Northern Europe, 15-20 days to the Middle East.
For importers testing a new market, the smart play is to start with Level 1 branding on a proven platform. Validate demand and certification acceptance before investing in custom engineering.
The 2026 Sourcing Playbook: Five Decisions That Determine Your Margin
After analyzing export data, compliance timelines, and cost structures, five decisions separate profitable water filter import operations from break-even ones:
1. Pick your certification lane first, supplier second. Decide which markets you’re entering and map the full certification matrix before you contact factories. A supplier with NSF but no WRAS is useless if you’re selling 30% of volume into the UK. Build the compliance map, then shortlist suppliers who already hold the right certificates for your markets.
2. Factor CBAM into your 2026-2027 pricing model. The EU carbon border adjustment isn’t going away — it’s expanding. If your supplier hasn’t started tracking carbon footprint per SKU, your EU landed cost will drift 8-12% above competitors who source from compliant factories. Make CBAM readiness a selection criterion, not an afterthought.
3. Order cartridges separately from systems. The structural shift toward modular cartridge exports means you can reduce your per-unit cost on complete systems (order the RO unit without cartridges from the system manufacturer) and source filter cartridges in volume from a dedicated cartridge supplier. The savings: typically 8-15% on the cartridge line item when bought in 5,000+ unit quantities.
4. Time your membrane negotiations. Domestic RO membrane capacity in China is expanding faster than demand. If your contract is up for renewal in Q3 or Q4 2026, you have leverage — supplier competition is intensifying. Lock in pricing now on 12-month contracts while capacity utilization is high but projected to soften.
5. Build a dual-supplier strategy for critical components. The pump, the RO membrane, and the solenoid valve are single points of failure in your supply chain. Qualify a backup supplier for each, even if you never split the order. A three-week delay on a pump shipment can cascade into a two-month delivery delay to your customers. The cost of qualifying a backup is negligible compared to the cost of a stockout.
The importers winning in 2026 aren’t the ones with the lowest unit price. They’re the ones who understand the supply chain as a system — certification timelines, membrane pricing cycles, freight lane volatility, CBAM compliance — and make sourcing decisions that optimize the system, not the line item.